Real-time storm tracking is essential for monitoring developing tropical systems in the Atlantic. The graphics below allow users to instantly see the chance of cyclone formation and review short- and long-term forecasts directly from the National Hurricane Center. This data is crucial during hurricane season, offering actionable intelligence for residents, emergency planners, and weather enthusiasts seeking real-time updates.

Live weather satellite map reveals current cloud structure and system organization, vital for assessing storm risk and movement.

Displays potential areas for tropical cyclone development over the next 48 hours, with percentage estimates for rapid situational awareness.
*This map is only active during hurricane season

Shows longer-range storm formation probabilities, helping users anticipate weather changes and make timely decisions.
*This map is only active during hurricane season
Understanding ocean temperatures and wave heights is critical when predicting hurricane intensification and coastal impacts. The ocean is a major energy source for tropical cyclones, and observing these variables can help forecast storm surge and flood risks along vulnerable coastlines. This data serves boaters, communities, and emergency managers during hurricane alerts.
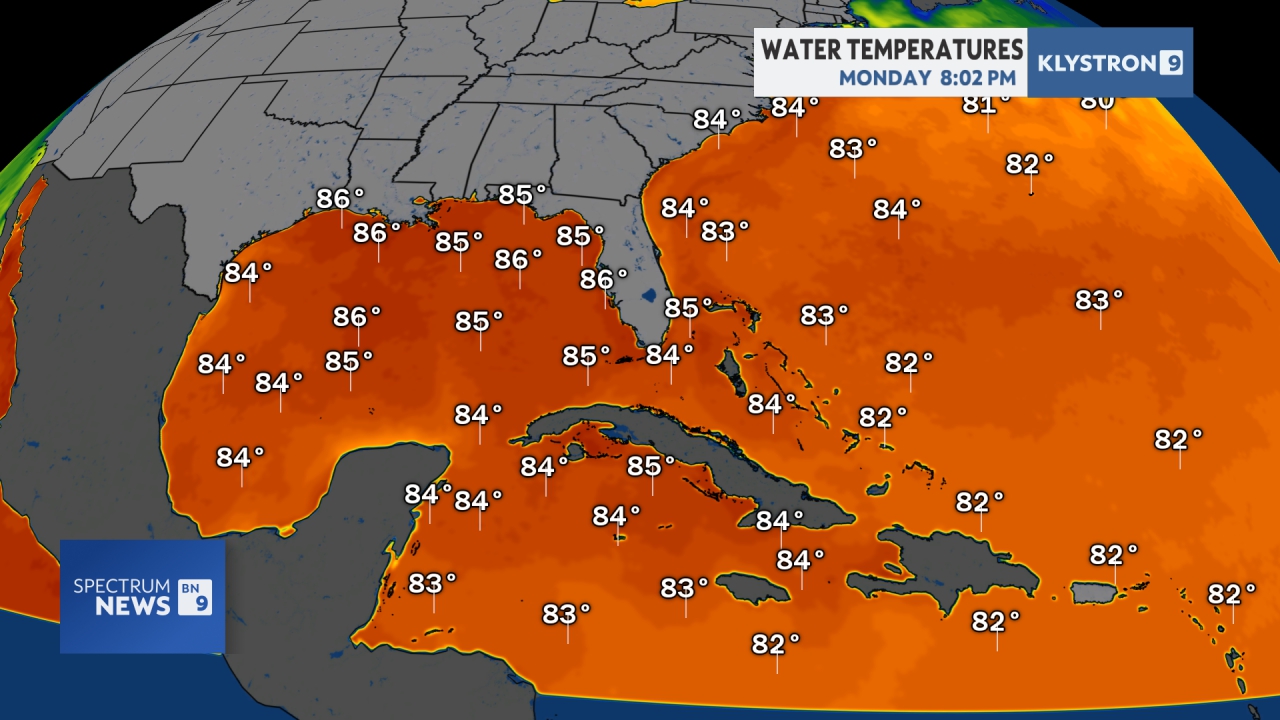
Showing hourly sea surface temperatures, with warmer zones supporting hurricane formation and intensification in the Gulf and Atlantic.

Real-time wave heights detail the risk for rough seas, dangerous currents, and coastal flooding during storm events.
Effective hurricane forecasting requires a comprehensive view of atmospheric pressure, wind, temperature, and moisture. These interactive maps and graphics provide meteorological insights into storm steering, wind speeds, and the total impact outlook for the Atlantic basin. Expert forecasters and concerned families alike are empowered by the latest weather prediction models and data feeds.
For deeper analysis and future planning, hurricane tracking sites rely on advanced model outputs and radar composites. This section features ECMWF, WRF, NAVGEM, and GFS model products, which allow users to investigate forecasted storm tracks, pressure fields, and precipitation trends. Meteorologists and preparedness coordinators use this data to assess risk and make informed decisions in real-time.
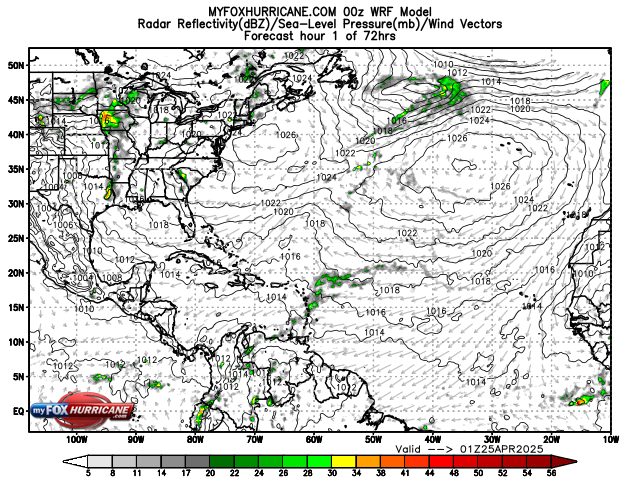
Radar composite shows ongoing precipitation and convection, revealing active rainfall zones and thunderstorm clusters.
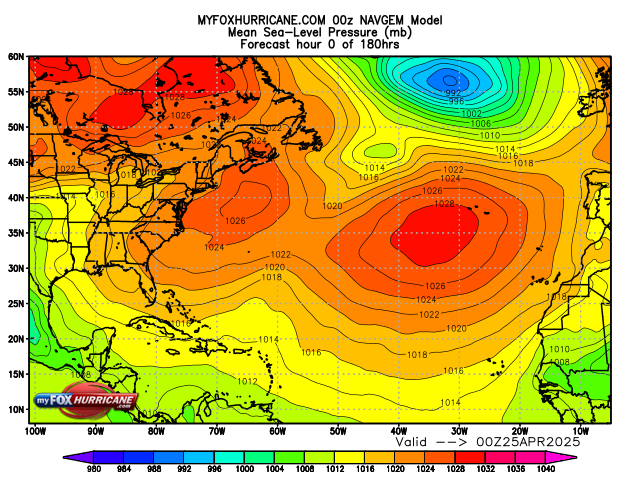
Displays forecasted pressure fields and cyclone risk areas using the NAVGEM global weather model.
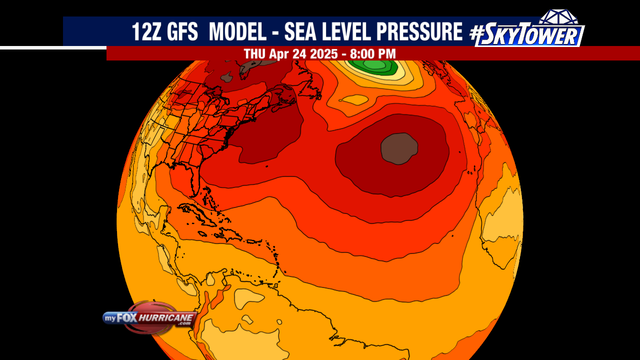
Outlines projected mean sea-level pressure for the Atlantic using the reliable GFS model, supporting forward-looking forecasts.